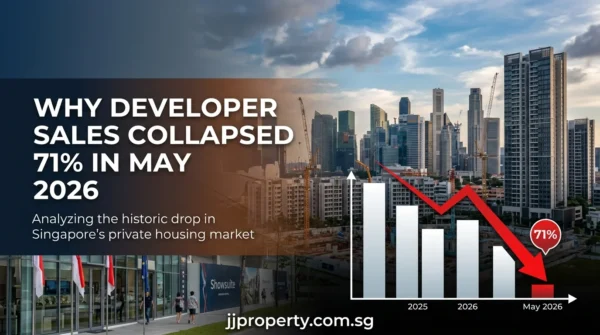
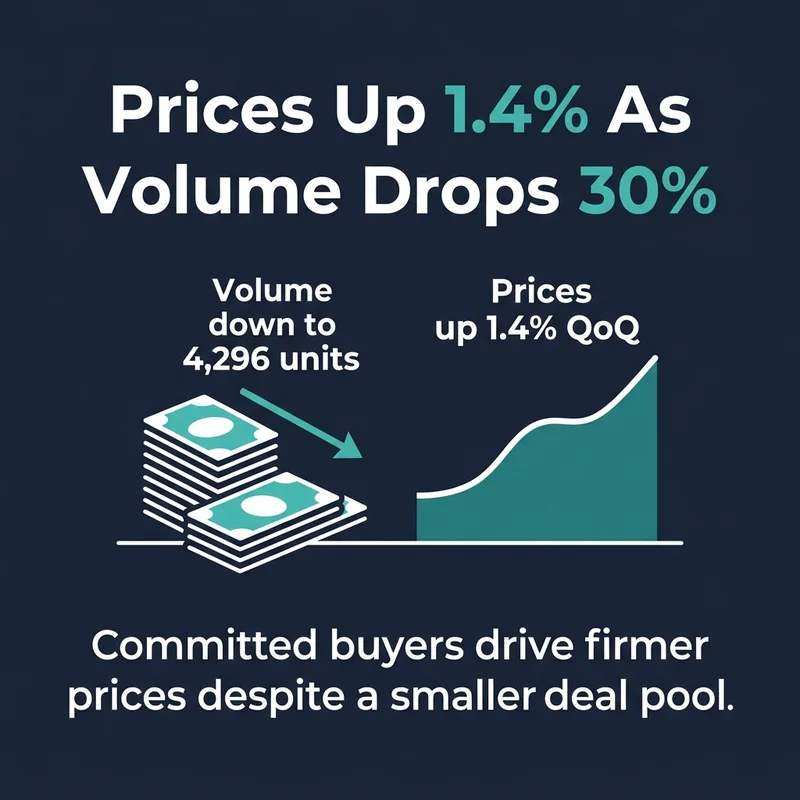
If you tried to transact a private home in Q3 2026, you would have noticed two things pulling in opposite directions: prices kept climbing, but the crowd of buyers thinned out noticeably. According to the Urban Redevelopment Authority’s (URA) flash estimate, overall private residential prices rose 1.4% quarter-on-quarter in Q3 2026, accelerating from 0.5% in Q2. At the same time, sale volume dropped roughly 30% to 4,296 units, down from 6,148 in Q2 (URA, 1 October 2026). The combination of fewer deals and firmer prices tends to make both buyers and sellers second-guess their timing.
Key Takeaways
- Overall private residential prices rose 1.4% QoQ in Q3 2026, up from 0.5% in Q2 2026, based on URA’s flash estimate released 1 October 2026.
- Private home sale volume fell approximately 30.1% QoQ to 4,296 units in Q3 2026, down from 6,148 units in Q2 2026, based on transactions recorded up to mid-September 2026.
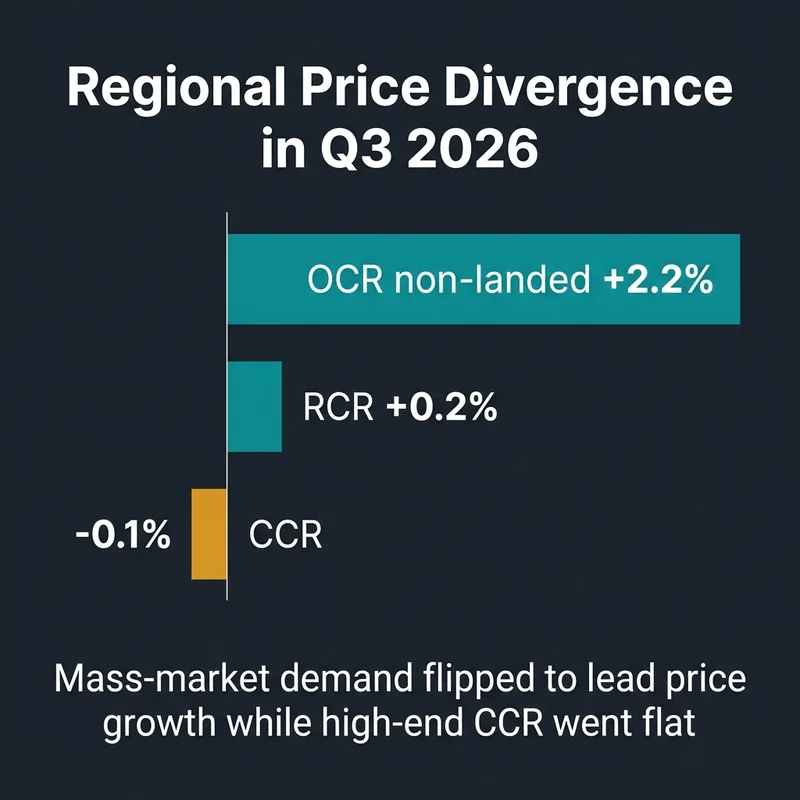
- Regional non-landed price momentum was uneven: OCR +2.2%, RCR +0.2%, CCR -0.1% QoQ, per the same URA release.
Why are private home prices up 1.4% in Q3 2026 while sales volume dropped 30%?
Prices rose because fewer transactions do not automatically mean weaker prices. It depends on what is actually transacting. URA’s flash estimate shows the overall private residential property price index climbing 1.4% quarter-on-quarter in Q3 2026, nearly triple the 0.5% pace recorded in Q2 2026 (URA, 1 October 2026). URA’s release notes that prices increased by an average of 0.9% per quarter over the first three quarters of 2026, unchanged from the average quarterly increase over the same period in 2025. The broader price trend has held steady even as transaction activity swings around.
Meanwhile, sale volume fell by about 30.1% quarter-on-quarter, from 6,148 units in Q2 2026 to 4,296 units in Q3 2026, based on transactions recorded up to mid-September 2026 (URA, 1 October 2026). Year to date, 15,857 private homes have changed hands, against 19,793 over the same period in 2025. This is a flash estimate, so the final count due on 23 October 2026 could shift slightly. But the gap between a thinner deal count and a firmer price index is the headline tension this quarter. It suggests committed buyers are still transacting at firm prices, even as the overall pool of transactions shrinks. This pattern echoes dynamics we flagged in why developers keep paying record land prices while sales slow: conviction concentrated among fewer players, rather than broad-based demand.
How do OCR, RCR, and CCR price indices perform differently in Q3 2026?
The regional divide in Q3 2026 was wide, led by the Outside Central Region (OCR). Non-landed private home prices in OCR rose 2.2% quarter-on-quarter, while the Rest of Central Region (RCR) inched up just 0.2%, and the Core Central Region (CCR) dipped 0.1% (URA, 1 October 2026). Note that these regional breakdowns apply specifically to non-landed private residential properties, while the overall 1.4% figure includes both landed and non-landed segments across all regions.
| Segment | Q3 2026 QoQ Change | Q2 2026 QoQ Change | Volume Context |
|---|---|---|---|
| Overall private residential | +1.4% | +0.5% | 4,296 units sold (-30.1% QoQ) |
| OCR (non-landed) | +2.2% | n/a | Outperformed all regions |
| RCR (non-landed) | +0.2% | n/a | Marginal uptick |
| CCR (non-landed) | -0.1% | n/a | Slight contraction |
*Source: Urban Redevelopment Authority, flash estimate, 1 October 2026.*
This is a notable reversal in pattern from what we documented in our earlier analysis of the CCR vs OCR regional divide, where CCR had been the outperformer and OCR lagged. The mass-market segment has now flipped to lead price growth, while the high-end CCR segment has gone flat to slightly negative. URA’s flash release does not break the regional movement down by project, so treat individual launches as context rather than the explanation. For supply-side background, see the Bayshore Drive GLS record of S$1,323 psf.
What do URA flash estimates for Q3 2026 mean for property investors?
The flash estimate suggests OCR-focused, mass-market demand is currently steadier than the overall transaction count implies, while CCR buyers appear more price-sensitive or simply sitting out. For investors weighing entry timing, the 30% volume drop matters more than the 1.4% price uptick: it indicates a narrower, possibly more selective buyer pool is driving the index, rather than broad market participation.
This matters for buyers such as owner-occupiers upgrading within the OCR segment, who may face firmer asking prices with fewer comparable transactions to benchmark against. It may also be relevant for investors evaluating CCR units, where near-flat to slightly negative price movement could reflect either a pause in demand or a temporary repricing window, though this is a single quarter’s flash data and should not be read as a trend reversal on its own. Anyone running affordability checks ahead of a purchase should also factor in financing capacity, which we cover in TDSR vs MSR 2026: how much can you actually borrow.
Risks and Considerations
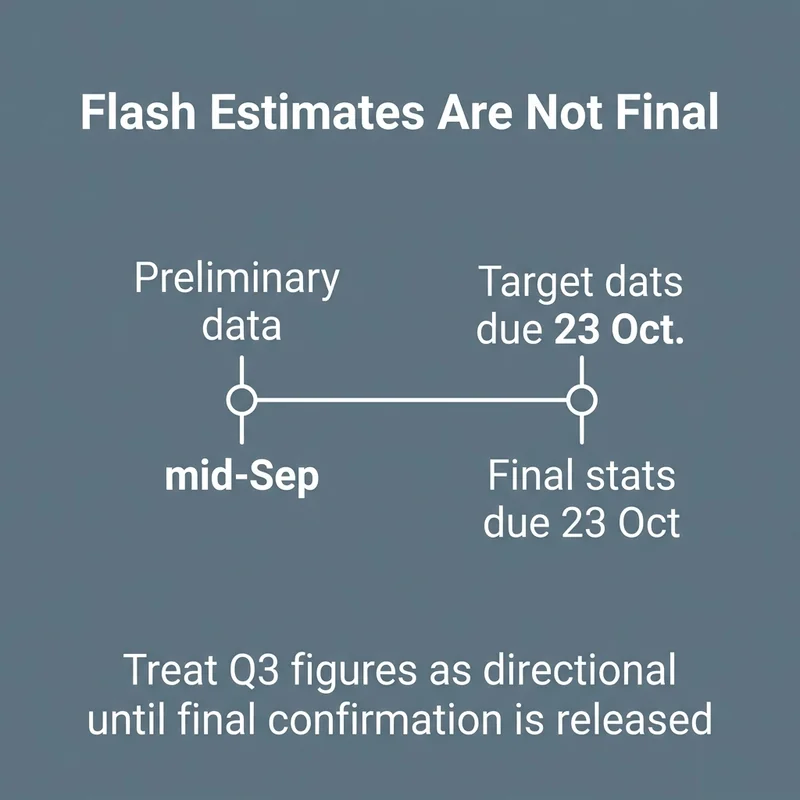
These are flash estimates, not final figures. URA’s own release notes that Q3 2026 data is compiled from transactions up to mid-September 2026, and the full quarter statistics (including the final price index and transaction count) are due on 23 October 2026 (URA, 1 October 2026). Flash estimates can be revised once the full data comes in.
A 30% drop in volume also means the price index is being calculated on a smaller, potentially less representative sample of transactions. A handful of high-value or low-value outlier deals can move a quarterly index more than they would in a higher-volume quarter. Readers should treat the 1.4% figure as directional rather than definitive until the 23 October release confirms it. Broader macro conditions (interest rates, cooling measure settings, and new supply from upcoming launches) sit outside the scope of this data release and should be checked separately before making decisions.
Frequently Asked Questions
What are the URA flash estimate figures for Q3 2026 private residential property prices?
URA’s flash estimate shows overall private residential prices up 1.4% quarter-on-quarter in Q3 2026, compared to 0.5% in Q2 2026. Regional non-landed price changes were OCR +2.2%, RCR +0.2%, and CCR -0.1% (URA, 1 October 2026).
How much did private home sales volume drop in Q3 2026 compared to Q2 2026?
Volume fell approximately 30.1%, from 6,148 units in Q2 2026 to 4,296 units in Q3 2026, based on transactions recorded up to mid-September 2026 (URA, 1 October 2026).
Which regional market drove private residential price momentum in Q3 2026?
The Outside Central Region (OCR) led price growth among non-landed properties, rising 2.2% quarter-on-quarter, well ahead of RCR’s 0.2% and CCR’s -0.1% (URA, 1 October 2026).
When will the final Q3 2026 real estate market statistics be released by URA?
URA is scheduled to release the full Q3 2026 private residential statistics, including finalised price index and transaction figures, on 23 October 2026 (URA, 1 October 2026).
Data Sources: All figures in this article are drawn from the Urban Redevelopment Authority’s flash estimate release for Q3 2026, published 1 October 2026 (URA). Figures are preliminary and subject to revision when final statistics are released on 23 October 2026.
If you are trying to work out whether current pricing and volume trends affect your own buying or selling timeline, feel free to message us on WhatsApp for a chat.
This article is for general reference only and does not constitute financial, legal, or investment advice. Verify all details with relevant authorities before making decisions.
Agent: Joe Chow | CEA Reg No.: R072635C
Agency: SRI Pte Ltd | Licence: L3010738A