
Here’s a number worth remembering next time you see a shiny gross yield figure on a listing: roughly a quarter of that headline return can quietly disappear once maintenance fees, property tax, agent commissions, and vacancy periods enter the picture. A unit advertised at 3.5% gross yield rarely delivers 3.5% back to your pocket, yet many buyers anchor their entire investment decision on that single number pulled from a portal.
This gap between gross and net isn’t a rounding error or a worst-case scenario. It’s the standard outcome once you account for the fixed and variable costs of owning a private residential unit in Singapore. This article breaks down where that gap goes, how gross yield is calculated versus what net yield actually measures, and what this means for how you evaluate a property’s income potential.
Key Takeaways
- Recurring maintenance costs and property tax typically reduce gross yield by an estimated 0.8 to 1.2 percentage points, based on common cost structures for private residential units.
- A 3.5% gross yield often results in a net yield of approximately 2.5% to 2.8% after statutory and operational deductions, though actual figures vary by unit and development.
- Properties with an Annual Value exceeding $30,000 face higher progressive property tax rates under IRAS’s structure, further compressing net returns.
Understanding the mechanics of gross vs net rental yield
Gross yield and net yield diverge because one measures rental income against purchase price with no deductions, while the other subtracts every recurring cost of ownership first. The formula for gross yield is straightforward: annual rental income divided by property purchase price, multiplied by 100. If a $1.2 million condo unit rents out at $3,500 a month, that’s $42,000 a year, or a 3.5% gross yield. This is the number typically shown on property portal listings, and it’s the number most buyers use to compare units against each other.
Net yield starts from that same $42,000 but strips out maintenance fees, property tax, fire insurance, agent commissions on securing tenants, and an allowance for vacancy periods between tenancies. Rental performance also varies by segment and region, meaning two units with identical gross yields on paper can carry materially different net yields once region-specific cost structures and rental volatility are factored in. Source: URA Realis rental data trends.

The core distinction to hold onto is this: gross yield is a marketing number, calculated once at the point of listing. Net yield is an ownership number, recalculated periodically as costs shift and rental income fluctuates with lease renewals.
Practical takeaway: treat gross yield as a screening tool for comparing listings, not as a return figure to base a purchase decision on.
Hidden costs reducing your annual rental income
The primary deductions reducing gross yield to net yield are maintenance fees, property tax, and agent commission, each of which chips away at the $42,000 gross figure before an investor sees actual cash flow. Maintenance fees for private condominiums typically range from an estimated $300 to $800 monthly depending on unit size and facilities offered, though precise island-wide averages are not consistently published and figures vary by development. Property tax for non-owner-occupied residential property is charged on a progressive scale based on Annual Value (AV), with rates rising above 12% for AV exceeding $30,000, according to IRAS property tax guidelines. Agent commission for securing tenants is usually half a month’s rent, borne by the landlord, plus incidental costs such as minor repairs between tenancies.
Using the $1.2 million unit renting at $3,500 monthly as a worked example:
| Expense Category | Estimated Monthly Cost ($) | Annual Impact ($) |
|---|---|---|
| Gross Rental Income | 3,500 | 42,000 |
| Maintenance Fees | 500 | 6,000 |
| Property Tax (Non-Owner Occupied) | 250 | 3,000 |
| Agent Commission/Miscellaneous | 150 | 1,800 |
| Net Rental Income | 2,600 | 31,200 |
This brings net yield to approximately 2.6%, consistent with the 2.5% to 2.8% range referenced earlier. Actual figures will vary based on unit-specific maintenance charges and AV assessments.

Practical takeaway: model net yield using your specific development’s maintenance quantum and current AV before comparing units on gross yield alone.
How property tax and maintenance fees impact cash flow
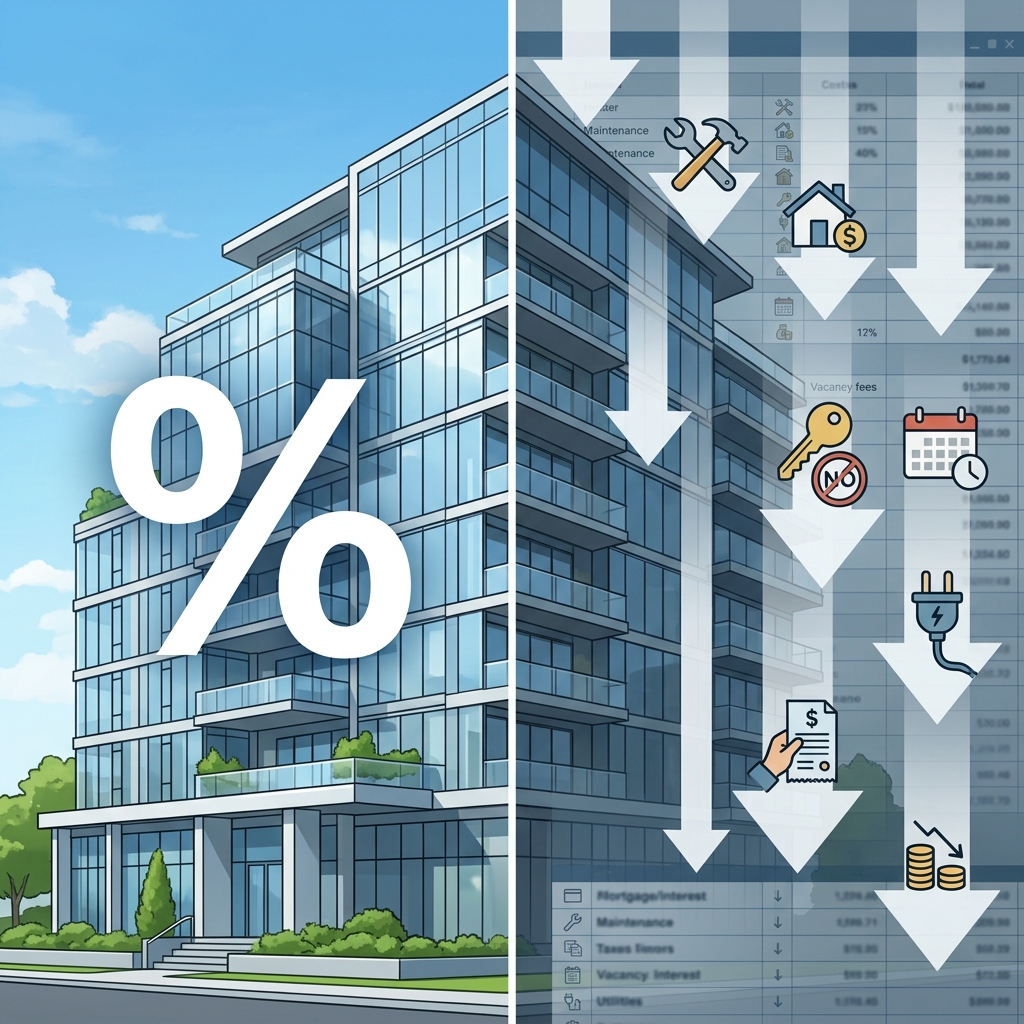
Property tax and maintenance fees consume a meaningful share of gross rental income before an investor sees any actual return, often turning what looks like a 3.5% gross yield into something closer to 2.5% net. Under IRAS’s progressive property tax structure for non-owner-occupied residential property, tax is charged on the Annual Value (AV), the estimated yearly rent the property could fetch, with rates scaling up as AV increases. For a condo unit with an AV of $42,000 (roughly matching the earlier $3,500 monthly rent example), the owner falls into the non-owner-occupied tax bands, which run notably higher than owner-occupier rates. Maintenance and management corporation (MCST) fees add another layer, typically ranging from an estimated $300 to $800 a month depending on development size, facilities, and unit share value, though figures vary widely by project. Together, these two recurring costs can total an estimated $6,000 to $12,000 annually on a $1.2 million unit, before factoring in fire insurance, agent commissions, or vacancy gaps between tenancies. None of these costs show up in the headline yield figure quoted on property portals, which is why two units advertising identical 3.5% gross yields can deliver different actual cash flow depending on MCST fee structure and tax exposure.
Practical takeaway: when comparing units on gross yield alone, request the latest MCST fee schedule and estimate property tax based on projected AV, since these fixed costs can shift net yield by a full percentage point or more.
Comparing net yield scenarios across different property types
Net yield scenarios diverge across property types primarily because maintenance fees, absolute price quantum, and achievable rents scale differently across CCR (Core Central Region), RCR (Rest of Central Region), and OCR (Outside Central Region) segments. A high-quantum CCR condominium with elevated maintenance fees, often at the upper end of the range cited earlier, may see a larger proportion of gross rent consumed by fixed charges compared to a smaller OCR unit, even where both post similar headline gross yields. Landed property, by contrast, typically carries no monthly maintenance fee at all, since there is no management corporation levying charges, though property tax on higher-AV landed homes can offset this saving given the progressive AV-based structure under IRAS.
Based on historical rental trends, landed and non-landed segments have shown divergent rental performance in recent quarters, suggesting yield sustainability can vary meaningfully by segment rather than moving uniformly across the market. Investors comparing CCR, RCR, and OCR net yields at a granular level should treat any percentage figures circulating in the market as estimates rather than confirmed data points, and verify current figures directly via URA Realis. Financing structure, particularly loan quantum and prevailing interest rates, further widens the gap between gross and net figures once mortgage servicing is factored in, though that calculation sits outside pure rental yield analysis.
Practical takeaway: base net yield comparisons across property types on each unit’s actual maintenance fee, AV-based property tax, and financing cost rather than published gross yield percentages, which do not capture these type-specific deductions.
Strategic considerations for long-term real estate holding
Long-term real estate holding requires investors to weigh recurring costs against the Seller’s Stamp Duty (SSD) holding period before deciding when, or whether, to exit a position. For purchases made on or after 4 July 2025, IRAS and MAS extended the SSD holding period from three to four years, with rates on the higher of selling price or market value at 16% within the first year, 12% within the second, 8% within the third, and 4% within the fourth. This means an investor who bought at $1.5 million and needed to sell within year two could face an SSD charge of $180,000, on top of the property tax and maintenance costs already narrowing net yield.
Investors often overlook that the IRAS property tax rate for non-owner-occupied homes is tiered and based on Annual Value, which may shift upward during periodic revaluations, meaning a 2.5% net yield calculated today could compress further if AV is reassessed higher in subsequent years. Based on historical trends, rental growth has also been uneven across segments, suggesting that yield sustainability may vary by segment rather than moving uniformly. For holders planning beyond the four-year SSD window, this combination of tiered tax exposure and segment-specific rental performance may be more relevant than the headline gross yield figure quoted at purchase.
Practical takeaway: investors evaluating long-term holds may find it useful to model net yield under a higher AV scenario and factor in the four-year SSD schedule before assuming a 3.5% gross yield will translate into comparable long-term returns.
Risks and Considerations
Investors relying on gross yield figures when evaluating rental properties face several practical risks.
Overestimation of returns. A property advertised at 3.5% gross yield may translate to a net yield closer to 2.0% to 2.5% once property tax, maintenance fees, agent commissions, and vacancy periods are factored in, based on typical cost structures for private residential units. Mitigation: request a full expense breakdown from the agent or seller and calculate net yield independently before committing.
Vacancy risk. Periods without a tenant reduce actual rental income but are often excluded from advertised yield calculations. Based on historical trends, older or less centrally located units may experience longer vacancy gaps between tenancies. Mitigation: budget for at least one to two months of vacancy annually when projecting net returns.
Rising interest rates. For leveraged purchases, mortgage servicing costs can erode net yield further, particularly if rates rise. Subject to market conditions, financing costs may fluctuate over the holding period. Mitigation: stress-test cash flow projections against higher interest rate scenarios before purchase.
Maintenance and capital expenditure. Older properties may require unplanned repairs or renovations that are not reflected in routine maintenance fee estimates. Mitigation: set aside a contingency reserve, commonly estimated at 5% to 10% of annual rental income.
Seller’s Stamp Duty (SSD) constraints. Properties purchased on or after 4 July 2025 are subject to a four-year SSD holding period, with rates of 16%, 12%, 8%, and 4% for disposals within the first, second, third, and fourth years respectively. This may limit an investor’s flexibility to exit early if yield expectations are not met. Verify holding period implications with IRAS before purchase.
Frequently Asked Questions
What is the difference between gross yield and net yield for Singapore property?
Gross yield is calculated as annual rental income divided by purchase price, without deducting any costs, while net yield subtracts property tax, MCST maintenance fees, insurance, and other recurring expenses first. On a $1.2 million condo, a 3.5% gross yield can compress to roughly 2.5% net once an estimated $6,000 to $12,000 in annual property tax and maintenance fees are factored in, based on IRAS’s AV-based tax structure.
How much is property tax on a rental condo in Singapore?
Property tax for non-owner-occupied residential property is charged progressively based on Annual Value (AV), the estimated yearly rent the unit could achieve, according to IRAS. A condo with an AV of $42,000 (matching around $3,500 monthly rent) falls into higher non-owner-occupier tax bands than owner-occupied homes, meaningfully reducing net yield compared to the headline gross figure.
How much are condo maintenance fees in Singapore?
Monthly MCST maintenance fees typically range from an estimated $300 to $800, depending on development size, facilities, and unit share value, though figures vary widely by project. These fees, combined with property tax, can total an estimated $6,000 to $12,000 annually on a $1.2 million unit, directly eroding gross rental yield.
Do landed properties have better net yield than condos in Singapore?
Landed properties avoid monthly MCST maintenance fees entirely since there’s no management corporation, but higher Annual Values often mean higher property tax under IRAS’s progressive structure. Based on historical rental trends, landed income may firm at a different pace than non-landed private residential rents, though actual net yield still depends on purchase price and financing costs.
What is the Seller’s Stamp Duty holding period for property bought after July 2025?
For purchases made on or after 4 July 2025, IRAS and MAS extended the Seller’s Stamp Duty (SSD) holding period from three to four years. Rates are 16% in year one, 12% in year two, 8% in year three, and 4% in year four, calculated on the higher of selling price or market value, meaning a $1.5 million property sold within year two could incur $180,000 in SSD.
Need Clarity on Your Next Property Move?
One message. No obligations. WhatsApp Joe →
This article is for general reference only and does not constitute financial, legal, or investment advice. Verify all details with relevant authorities before making decisions.
Joe Chow | CEA Reg No.: R072635C
SRI Pte Ltd | Licence: L3010738A
Contact: +65 8098 0916