
The Outside Central Region (OCR) — Singapore’s traditional mass-market residential belt spanning areas such as Jurong, Woodlands, Tampines, and Sengkang — recorded a median transaction price of $2,150 psf as of June 2026, according to URA Realis caveat data. That single figure quietly dismantles a long-held assumption: that OCR pricing moves as a broadly uniform block. It does not.
What the June data confirms is that the OCR has effectively split into three distinct price tiers, each driven by a different buyer profile, location premium, and project positioning. The OCR non-landed price index rose 2.2% quarter-on-quarter in Q1 2026, based on URA’s Private Property Price Index series published on data.gov.sg — yet that aggregate figure conceals materially different performance across sub-locations. Divergence, not uniform growth, is the defining story of 2026.
Key Takeaways
- The OCR median stands at $2,150 psf as of June 2026, masking a spread from approximately $1,700 psf to above $2,400 psf across three measurable price tiers (Source: URA Realis caveat data, Q1–Q2 2026).
- The revised Seller’s Stamp Duty schedule, effective 4 July 2025, extends the dutiable holding period to four years for new purchases — reshaping exit planning for OCR buyers at every tier.
- MRT corridor alignment, remaining lease tenure, and supply timing are the three variables that most consistently explain which tier a project occupies.
- Buyers benchmarking only against the OCR regional average risk mispricing a specific asset by $300–$500 psf, depending on tier.
The Emergence of Three Price Tiers in the OCR
Transaction-level caveat data from URA Realis through June 2026 makes the segmentation clear. The regional median of $2,150 psf masks a spread running from approximately $1,700–$1,900 psf at the lower end, through a mid-band of $1,900–$2,200 psf, to a premium tier crossing $2,200 psf — with select projects in well-connected OCR nodes transacting above $2,400 psf.

The lower tier is largely defined by older 99-year leasehold developments in outer fringe districts such as Woodlands and parts of Jurong West, where remaining lease and limited MRT proximity compress pricing. The mid-tier captures the bulk of new launches in established OCR towns — Tampines, Sengkang, and Bukit Panjang — where median new-sale caveats have clustered between $1,950 and $2,150 psf (Source: URA Realis caveat records, Q1–Q2 2026). The premium tier is occupied by projects positioned near OCR MRT interchange nodes or with rare freehold tenure, where buyer profiles increasingly overlap with the Rest of Central Region (RCR), Singapore’s city-fringe belt.
| Tier | Estimated Range (PSF) | Typical Location Characteristics |
|---|---|---|
| Tier 1 (Premium Suburban) | $2,200 – $2,400+ | MRT-adjacent, new or recent TOP, lifestyle amenities |
| Tier 2 (Growth Corridor) | $1,900 – $2,200 | Established towns, mid-vintage stock, good schools |
| Tier 3 (Established Value) | $1,700 – $1,900 | Outer fringe, older leasehold, thinner transaction volumes |
Source: URA Realis caveat data, Q1–Q2 2026. Tier classifications are analytical constructs, not official URA designations.
Practical takeaway: The roughly 22% price spread between Tier 1 and Tier 3 OCR properties means referencing only the regional average may produce a benchmark that is unrepresentative of the specific asset being assessed.
Drivers Behind the Price Divergence
Three structural forces explain why OCR pricing has separated into distinct tiers rather than moving as a uniform band.
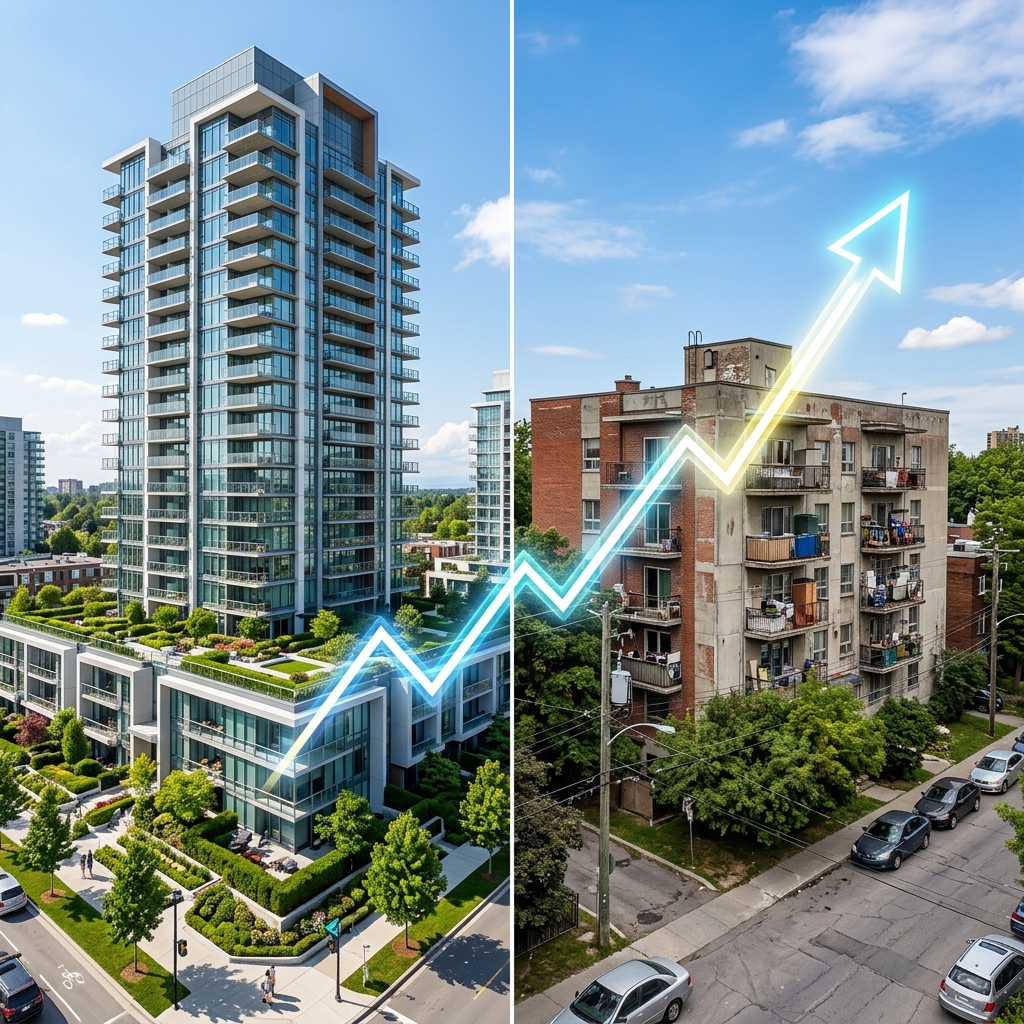
MRT proximity remains the dominant pricing variable. OCR nodes along the Thomson-East Coast Line (TEL) and Cross Island Line (CRL) corridors consistently transact at the upper end of the regional range, reflecting buyer willingness to pay a structural premium for commute certainty. Older leasehold stock in peripheral districts faces compounding headwinds from lease decay and thinner liquidity.
Lease profile acts as a long-run return modifier. Projects with remaining tenures below 70 years face resale liquidity constraints that freehold and 99-year new-launch stock does not — a distinction that grows more relevant as holding periods extend beyond five years.
The revised SSD schedule — effective 4 July 2025, extending the dutiable holding period to four years at rates of 16%, 12%, 8%, and 4% (Source: IRAS / MAS, July 2025) — has reduced short-cycle trading and concentrated volume among genuine owner-occupiers and longer-horizon investors. This reinforces premium pricing at well-specified projects where fundamentals justify the hold.
Practical takeaway: Buyers comparing headline OCR medians without filtering for connectivity and lease profile may be benchmarking against an unrepresentative figure — the tier gap is structural, not cyclical.

New Launch vs Resale: A Quantifiable Premium
New launches in the OCR are commanding a measurable premium over resale units in the same submarket, and the gap has widened through 2025 into 2026. Median new-sale transactions in active OCR launch projects have clustered between $1,950 and $2,150 psf, while resale caveats for comparable 99-year leasehold non-landed units in the same districts have traded at $1,700–$1,900 psf over the same period (Source: URA Realis caveat records, Q1–Q2 2026).
That spread of approximately $250–$300 psf represents a new-launch premium of roughly 13–16% on a psf basis. Buyers acquiring resale units in districts such as Woodlands or outer Jurong West are, in part, pricing in lease decay and limited transport connectivity — which explains, rather than invalidates, the discount.
Practical takeaway: The new-launch premium is real and quantifiable at roughly 13–16% psf over resale comparables. Buyers should weigh this differential against the remaining-lease profile and location attributes of each option before committing.
Exit Planning Under the Revised SSD Rules
Any private residential property purchased on or after 4 July 2025 is subject to the revised Seller’s Stamp Duty (SSD) schedule — a four-year dutiable holding period at rates of 16% (within year 1), 12% (within year 2), 8% (within year 3), and 4% (within year 4), applied to the higher of the sale price or market value at disposal (Source: IRAS / MAS, effective 4 July 2025).
For OCR buyers entering at current new-launch medians of $1,950–$2,150 psf, this extended holding period has a direct bearing on break-even calculations. An owner selling at the two-year mark faces a 12% SSD liability on the full transaction value — a materially higher cost drag than many OCR investors historically factored into short-cycle exit plans.
Projects positioned within the catchment of announced-but-incomplete transport nodes — identifiable through LTA’s Land Transport Master Plan and URA Master Plan 2019 zoning overlays — may carry stronger medium-term capital value support across the four-year holding window, based on historical OCR transaction patterns at comparable corridor-adjacent projects.
For properties purchased before 4 July 2025, the prior three-year SSD schedule at rates of 12%, 8%, and 4% continues to apply, per IRAS guidance.
Practical takeaway: Map your intended disposal date against the four-year SSD schedule before committing, and factor the full 16–4% liability band into your net proceeds modelling at each exit point.
Frequently Asked Questions
What is the current price psf for OCR new launch condos in 2026?
Median new-sale transactions in active OCR launch projects have clustered between $1,950 and $2,150 psf, based on URA Realis caveat records for Q1–Q2 2026. The OCR regional median across all transaction types stands at $2,150 psf as of June 2026.
How much did OCR condo prices increase in 2026?
The OCR non-landed price index rose 2.2% quarter-on-quarter in Q1 2026, per URA’s Private Property Price Index series on data.gov.sg. Q2 2026 index data had not been released by URA as of this publication, so characterisation of second-quarter momentum across the full region remains premature.
What are the new SSD rules for Singapore property purchases from July 2025?
For private residential properties purchased on or after 4 July 2025, the revised SSD schedule applies a four-year holding period. Rates are 16% (year 1), 12% (year 2), 8% (year 3), and 4% (year 4), applied to the higher of sale price or market value. Properties purchased before that date retain the prior three-year schedule at 12%, 8%, and 4% (Source: IRAS / MAS, July 2025).
Is it better to buy a new launch or resale condo in the OCR?
The new-launch premium currently stands at roughly $250–$300 psf above resale comparables, based on URA Realis caveat data for Q1–Q2 2026. Neither option is categorically superior — the right choice depends on a buyer’s entry budget, intended holding period, lease-tenure preference, and how each specific project’s fundamentals align with their profile.
Which OCR areas have shown the strongest transaction volumes?
Based on URA Realis caveat records through Q1 2026, integrated development nodes along the Thomson-East Coast Line and Cross Island Line corridors have sustained transaction volumes above the OCR regional average over the preceding four quarters. Buyers should cross-reference transaction velocity, MRT corridor alignment, and remaining lease tenure when evaluating individual projects.
Need Clarity on Your Next Property Move?
One conversation. No obligations. We’ll help you work through the numbers properly.
Data Sources: All figures sourced from URA Realis, URA Private Property Price Index (data.gov.sg), IRAS, MAS, and LTA publications. Data current as of Q1–Q2 2026.
This article is for general reference only and does not constitute financial, legal, or investment advice. Verify all details with relevant authorities before making decisions.
Agent: Joe Chow | CEA Reg No.: R072635C
Agency: SRI Pte Ltd | Licence: L3010738A
Contact: +65 8098 0916